A journey through the history of science through 300 illustrations

Science has always been and must be enlightened. Taschen Publishing has collected 300 major works from all scientific fields into a booka visual history of knowledge from the fifteenth century to the present, from the first detailed drawing of the moon to the first diagram of a cell.
The large-format book by science conductor Anna Escardo includes explanatory texts in English, Spanish, and Italian, and includes original drawings, technical drawings, and accurate hand-drawn illustrations or more current computer-generated images.
Andreas Vesalius, Isaac Newton, Marie Curie, Santiago Ramón y Cajal, Rosalind Franklin or Jocelyn Bell They are the protagonists of this collection whose author wants the public to connect with science: “I would like,” she tells Efe, “for the reader to experience the book as a celebration of science and understand that this is not just a small thing of an elite genius.
After about two and a half years of work, Escardó shows how the field of illustration and the development of knowledge have been inextricably intertwined for some time: the first drawings worthy of the designation of scientific illustration date back to the Middle Ages, when manuscript books were produced in monastic writing rooms, as the author explains in her.
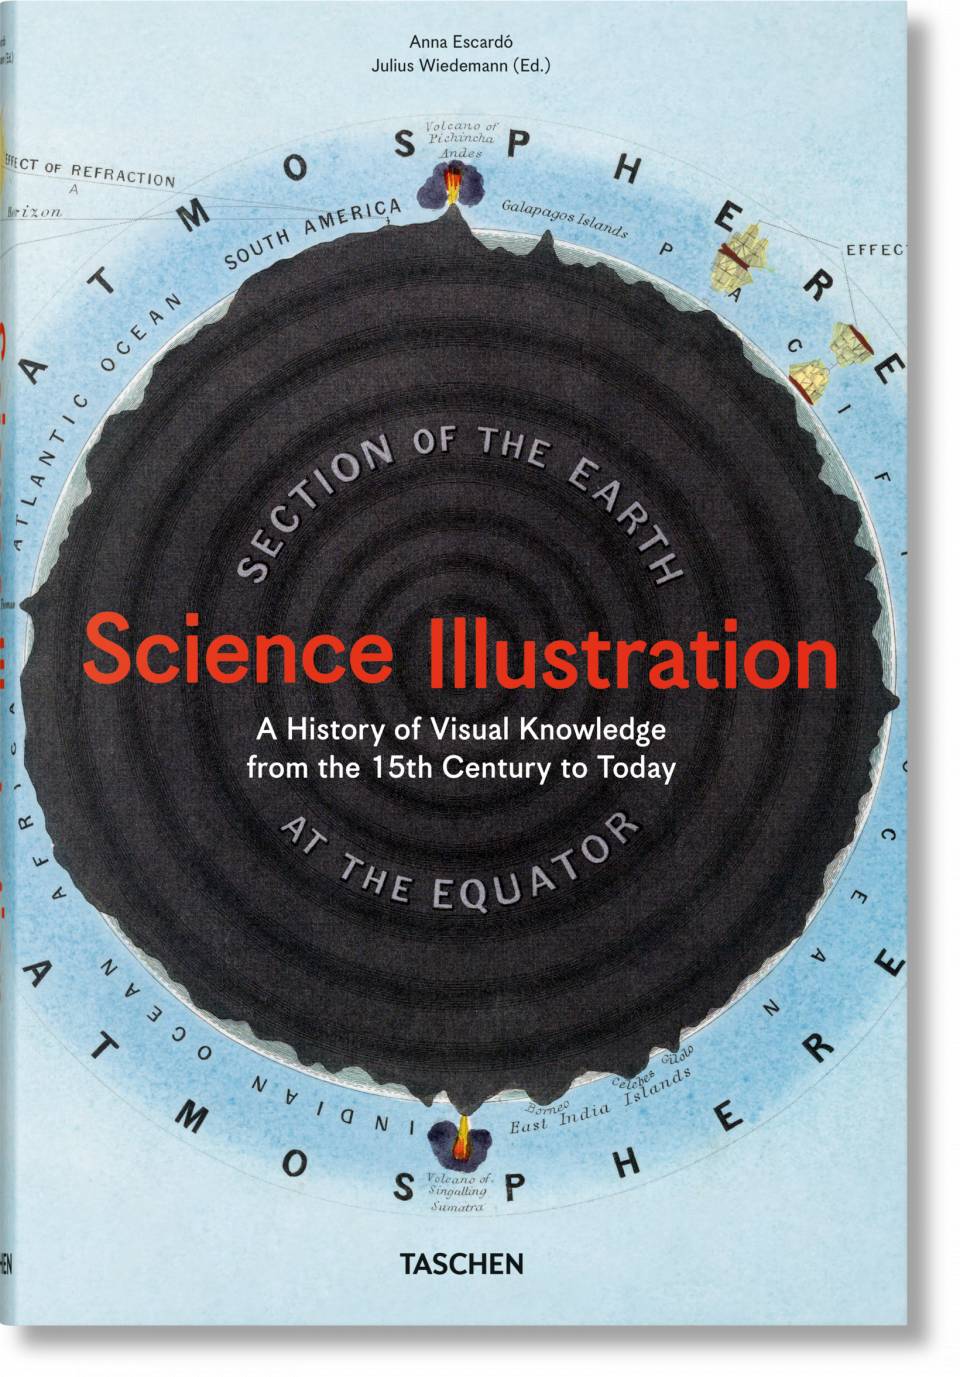
Under the original title flag illustration also Scientific illustration. The visual history of knowledge from the fifteenth century to the presentThe book is divided into centuries, beginning with the fifteenth to seventeenth, then eighteenth, nineteenth, and ending with the “twentieth century and beyond.”
in your pages You can see, for example, details of the human body in an illustration by the physician Andreas Vesalius (1543); A turtle drawn by botanist and naturalist William Bartram (1791); Or the first cell division documented by German physician Walter Fleming (1882).
Also Curie’s comments on her experiments or the periodic table of the elements for Dmitri Mendeleev.
The author details that many consider this design by the Russian chemist from 1869 to be the best scientific illustration in the history of science, due to its balance between the precise synthesis of information from all known elements (63) and its ability to predict not yet known physical and chemical properties.
Escardo recounts that with his publisher, Julius Wiedemann, They were clear that the scientific milestones that appeared in the book must be those that marked the before and after in humanityVisualizations present groundbreaking ideas and discoveries from the fifteenth century to the present day.
In addition, they wanted to “show those silenced by Western culture, celebrate the remarkable work of many scholars who were also in hiding, and leave little room for simple curiosity.”
“Science should always be informed. Scientific illustration is a tool used to present scientific information, but also to study, catalog, project, understand, synthesise, disseminate, and communicate,” sums up its author.
All the The “technological arsenal” that exists today (Photography, video, 3D scanner, MRI, CT, etc.) And the one to come after, “The scientific illustrations do not compete but provide them, they are contributors to the illustrator’s field notes.”
The image, for example, captures the raw data of the moment, it is a “mound of information” for the observer, while the illustration shows the exact data the scientist needs.

“Award-winning zombie scholar. Music practitioner. Food expert. Troublemaker.”

/cloudfront-eu-central-1.images.arcpublishing.com/prisa/AHVYMMDSTZDTDBFNZ3LMFUOKNE.jpg "La Palma Eruption “Historicers,” SINC Track and Rafael Bachiller, CSIC-BBVA Science Communication Awards | Sciences")


